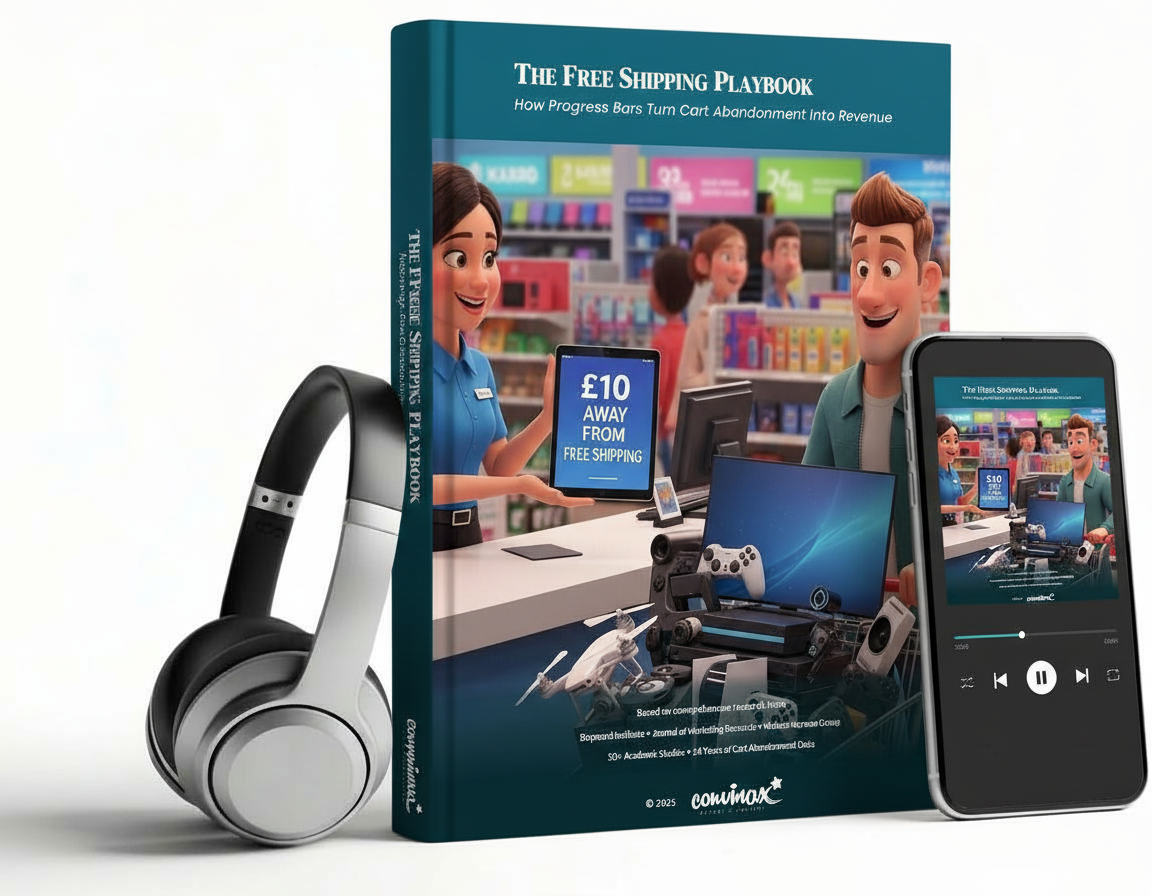
STOP LOSING SALES! Why Your Brain Makes You Buy More to Get “FREE” Shipping
You’re losing customers you’ve already won.
They found your site. They browsed your products. They added items to their cart.
Then they left.
Not because your prices were wrong. Not because a competitor undercut you. Because at the worst possible moment – right before they handed over their card details – something in your checkout quietly pushed them away.
Forty-eight per cent of cart abandonments happen for a single, fixable reason. And most e-commerce businesses are leaving the solution sitting right there in plain sight, unimplemented.
This article is about that fix.
What You’re About to Read
This isn’t a listicle of generic tips. It’s a research-backed breakdown of one specific tactic – the free shipping progress bar – examined through the lens of behavioural economics, real-world A/B testing data, and cross-platform performance analysis.
The article draws on more than 50 academic studies, 14 years of cart abandonment data from the Baymard Institute, and controlled case studies from real e-commerce brands. Then it tells you exactly what to do with all of it.
It’s the kind of piece that earns a permanent tab in your browser.
Before You Read On – Here’s What the Research Reveals
These aren’t opinions. They’re findings from peer-reviewed journals, independent research institutions, and live A/B tests. Most of them will surprise you.
The article reveals…
- How much additional monthly revenue a single UI change generated for one UK fashion brand – and why the mechanism had nothing to do with design
- Why customers will voluntarily spend more money to avoid a fee that costs less than what they’re spending – and the Nobel Prize-winning science that explains it
- The precise percentage above your current average order value where your free shipping threshold should sit – and why most brands set it in completely the wrong place
- What happened when one supplement brand raised its threshold above its product price point – and why the result was the opposite of what common sense would predict
- Why mobile shoppers behave so differently at the cart stage, and what that means for where and how you display this particular element
- The psychological effect – backed by a 2006 Journal of Marketing Research study – that causes customers to accelerate their buying behaviour the closer they get to a goal
- Why one brand tested multiple free shipping bar placements and saw zero improvement – and the specific conditions under which this tactic doesn’t work
- How a car wash loyalty card experiment from a university research team directly predicts your cart conversion rate
Subjects discussed in depth:
- The “Head Start” Illusion: Why Fake Progress Works
- The 84% Rule: The Magic of Proximity
- Loss Aversion: The “Pain of Paying”
- The Mobile Conversion Trap
- Controversial Tip: Setting the Threshold at Your AOV?
This isn’t about adding more tactics to your already overwhelming to-do list. It’s about understanding which lever actually moves the needle – and having the data to prove it to stakeholders.
This booklet synthesises findings from:
Peer-Reviewed Academic Studies
The foundational evidence for the “Progress to Free Shipping Bar” comes from behavioural psychology and marketing journals.
- The Goal-Gradient Hypothesis: Research published in the Journal of Marketing Research by Kivetz, Urminsky, and Zheng (2006) provides the primary theoretical basis, proving that consumers accelerate their efforts as they approach a reward.
- The Endowed Progress Effect: Findings from the Journal of Consumer Research (Nunes & Drèze, 2006) demonstrate that perceived “head starts” increase the likelihood of goal completion.
- Cognitive Load and Decision Science: Studies from the Journal of Consumer Psychology and ScienceDirect examine how information overload and decision fatigue impact e-commerce conversions.
- Behavioural Economics: The sources draw on Nobel-prize-winning research from Richard Thaler and Kahneman & Tversky regarding Loss Aversion and the Zero Price Effect.
Specialised Industry Research & Benchmarks
The articles rely heavily on large-scale usability studies and cross-merchant analytics.
- Usability Testing: The Baymard Institute is cited extensively for its 14-year meta-analysis of checkout usability, which involved over 272 test subjects and 50 aggregated studies.
- User Experience (UX) Standards: Research from the Nielsen Norman Group (NNg) is used to establish best practices for visual hierarchy and “visibility of system status”.
- Consumer Expectations: Large-scale surveys such as the UPS “Pulse of the Online Shopper” and the National Retail Federation (NRF) Consumer View report provide data on shopper behaviour and shipping expectations.
- Platform Data: Statistics from e-commerce giants and service providers like Shopify, BigCommerce, Klaviyo, and Adobe Analytics are used to establish industry conversion and AOV benchmarks.
Controlled Experiments and A/B Testing
To validate theoretical principles in real-world settings, the sources include results from specific agency-led experiments.
- Swanky Agency: Conducted 14-day A/B tests on dynamic banners, reporting a 32% improvement in net profit and specific AOV uplifts across devices.
- Invisible Prime: A controlled A/B test for a mid-size brand documented an 5% lift in AOV specifically due to the addition of a dynamic progress bar.
- Growth Rock (NuFACE Case Study): An A/B test resulting in a 90% increase in orders after implementing a free shipping threshold.
Biological and Observational Research
Some of the most specialised insights come from measuring physical responses.
- Eye-Tracking Research: Used to confirm that progress bars capture the most attention when positioned immediately below the header.
- EEG Biosensors: Research using brain-sensing technology reveals how cognitive load increases and attention spans decrease for mobile users under time pressure.
Real-World Case Studies
The sources analyse the implementations of industry leaders to provide directional evidence.
- Brands Analysed: Strategies from companies like Amazon, ASOS, Gymshark, Huel, Nike, and Sephora are cited to illustrate high-impact implementations across different retail verticals.
- Sector-Specific Benchmarks: Data is stratified across industries, including Fashion, Tech, Beauty, and Food/Delivery, to show how progress bar efficacy varies by product type.
Every claim is cited. Every statistic is sourced. Every recommendation is testable.