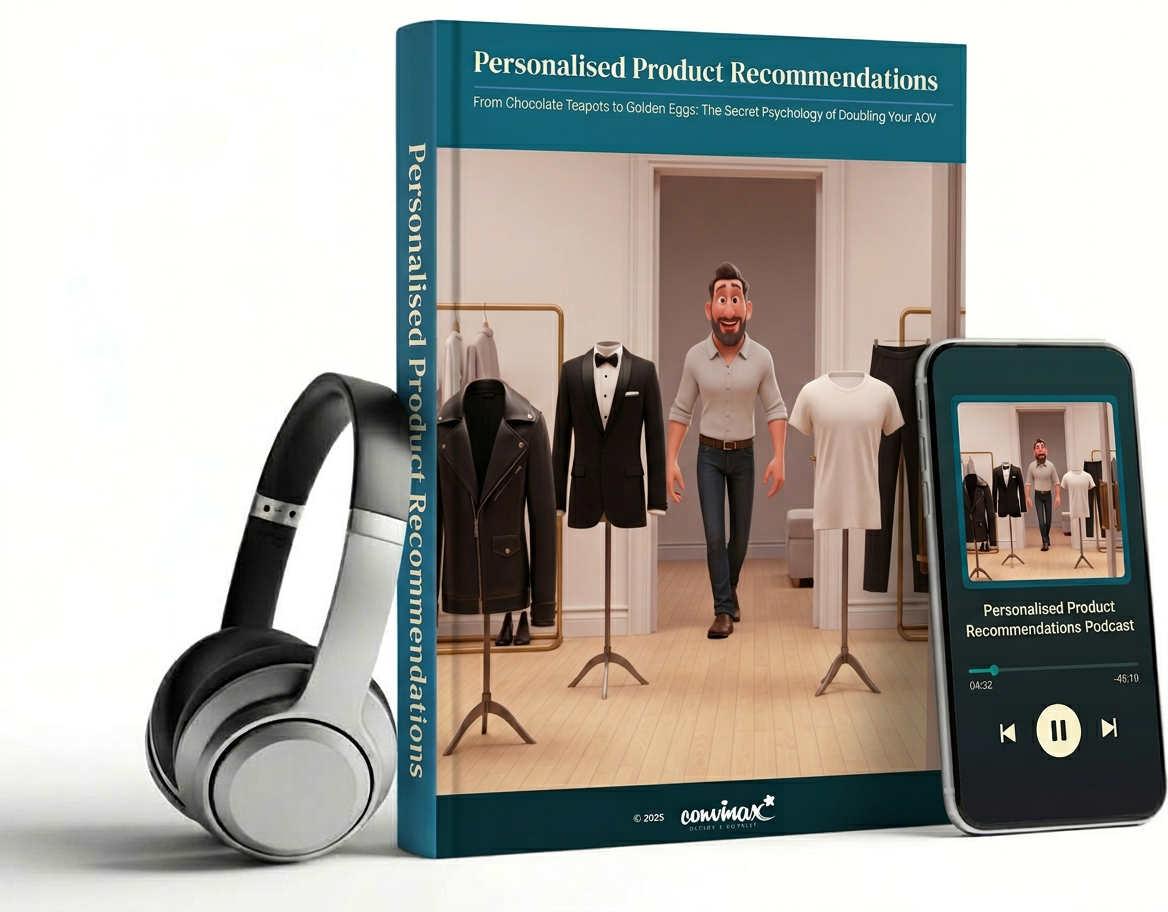
Personalised Cross-Selling – Increase Average Order Value

£17.50

This booklet synthesises findings from: Academic and Peer-Reviewed Research The core psychological and technical foundations are drawn from formal academic studies: Cognitive Psychology & Behavioural Economics: Findings on Cognitive Load Theory and Decision Fatigue are based on foundational research by John Sweller and meta-analyses of choice overload from sources like ScienceDirect and Oxford Academic. Attention Economics: Research from the National Bureau of Economic Research (NBER) is used to define attention as a scarce resource for which firms compete. Specific University Studies: A Carnegie Mellon University randomised field experiment (published in Management Science) involving 184,375 users provided data on how recommender systems increase conversion rates by…

You installed the widget. You followed the playbook. So why aren’t conversions moving?

You’re not alone in this. E-commerce owners, CRO managers and growth marketers spend thousands on recommendation engines, AI-powered widgets and “customers also bought” sections – then watch their average order value flatline.

It’s not the technology that’s broken. It’s the thinking behind it.

Most sites make the same handful of mistakes – and they’re doing it right now, confidently, with data dashboards open and A/B tests running. The problem is that they’re optimising for the wrong things, in the wrong places, on the wrong devices, for the wrong reasons.

This article – and the accompanying audio overview – cuts through the noise.

It draws on peer-reviewed research, large-scale field studies and real-world case data to show you exactly what’s going wrong, and what actually works.


What the Article Reveals

A specific case study shows a 259% increase in AOV within a single month. The article reveals why this result had almost nothing to do with the technology used – and everything to do with one fundamental shift in approach.

One metric that most CRO teams obsess over is essentially meaningless as a measure of cross-sell performance. The article reveals which metric to track instead, and why the popular alternative is leading teams to the wrong conclusions.

A landmark study of 184,375 users found that a specific type of cross-selling algorithm produced a 192.9% increase in cross-sell conversion rate. The article reveals what that algorithm did differently – and how smaller sites can apply the same logic without enterprise-level budgets.

There is a precise moment in the customer journey where a cross-sell suggestion costs you zero friction. The article reveals exactly when it is, why it works psychologically, and why the majority of e-commerce sites skip it entirely.

Desktop versus mobile conversion rates are not as far apart as most industry benchmarks suggest – but the behaviour patterns are dramatically different. The article reveals what that means for how, where and when you should be showing recommendations on each device.

Cognitive psychology research establishes a specific threshold for how many recommendations you should ever show at once. The article reveals the number, why exceeding it actively harms conversions, and the neuroscience behind it.

A study of 243,000 consumers found a content-based intervention that outperformed a direct price reduction. The article reveals what that intervention was, why it works, and how to apply it to your own product pages.

The world’s most successful recommendation engine – responsible for over 80% of engagement on its platform – does not work the way most e-commerce owners think it does. The article reveals the principle behind it that any site, at any scale, can be borrowed immediately.

Diving deep into:

  • The “Magic Number Seven” Trap
  • The Tablet Conversion Secret
  • The 1.4-Second “Scan” Rule
  • The “Review Reordering” Cheat Code
  • The Mobile “Research” Paradox
  • The Adidas “Gold Standard”
  • The “Thumb-Friendly” Rule
  • Post-Purchase is the “Hidden” Profit Zone
  • Does Relevance Trump Popularity


This isn’t about adding more tactics to your already overwhelming to-do list. It’s about understanding which lever actually moves the needle – and having the data to prove it to stakeholders.

Formal Bibliography of Research Sources

Academic and Peer-Reviewed Research

The core psychological and technical foundations are drawn from formal academic studies:

  • Cognitive Psychology & Behavioural Economics: Findings on Cognitive Load Theory and Decision Fatigue are based on foundational research by John Sweller and meta-analyses of choice overload from sources like ScienceDirect and Oxford Academic.
  • Attention Economics: Research from the National Bureau of Economic Research (NBER) is used to define attention as a scarce resource for which firms compete.
  • Specific University Studies: A Carnegie Mellon University randomised field experiment (published in Management Science) involving 184,375 users provided data on how recommender systems increase conversion rates by 7.5%.
  • Large-Scale Observational Data: The Liu et al. (2017) study synthesised data from 243,000 UK consumers across 600 categories to measure the impact of content reordering on sales.

Industry Research and UX Benchmarking

Practical implementation standards are synthesised from leading user experience (UX) research houses:

  • The Baymard Institute: Provides large-scale UX benchmarking and usability testing across thousands of pages to determine optimal placement for cross-sell widgets.
  • Nielsen Norman Group (NN/g): Used for eye-tracking lab studies that established the “1.4-second scan rule” and the effectiveness of above-the-fold recommendations.
  • McKinsey & Company: Cited for industry-wide benchmarks, such as the finding that 35% of Amazon’s purchases are driven by its recommendation engine.

Controlled Experiments and A/B Testing Analysis

The quantitative proof of revenue impact comes from aggregated experimental data:

  • Meta-Analysis of Experiments: Data from Growth Rock synthesised results from over 200 A/B experiments, revealing an average £55 increase in AOV with 90-95% statistical significance.
  • A/B Testing Frameworks: Best practices are synthesised from testing platform documentation, including Optimizely, AB Tasty, and CXL, focusing on Minimum Detectable Effect (MDE) and sample size calculations.

Real-World Case Studies and Platform Data

The articles use specific commercial successes to illustrate “Gold Standard” implementations:

  • Retail Giants: The Adidas case study (via Emarsys/SAP) shows a 259% AOV increase within one month.
  • Streaming Services: The Netflix model is used to demonstrate how 80% of consumption can be driven by personalisation.
  • E-Commerce Platforms: Aggregated data from Shopify, Klaviyo, and Barilliance provides benchmarks for device-specific performance, such as tablet conversion rates peaking at 3.1%.

Cross-Platform and Device Analytics

Findings regarding user journeys are synthesised from digital market intelligence:

  • Performance Benchmarking: Data from EMARKETER, Statista, and Adobe Analytics are used to contrast desktop and mobile conversion behaviours.
  • Mobile-First Research: Studies on the “cross-device journey” highlight that 77% of users search on mobile while in-store, even if they finish the purchase on a desktop.

Every claim is cited. Every statistic is sourced. Every recommendation is testable.

0