STOP Using “Add to Cart”! | The 332% Conversion Secret Your Competitors Are Hiding
Your product page isn’t the problem. Your CTA is.
You’ve invested time, money, and real effort into your product pages. The photos are clean. The copy is sharp. The checkout works.
So why is the majority of your traffic still leaving without buying?
Here’s what most conversion guides won’t tell you: the button that sits at the heart of every product page – the one element every visitor sees – is likely doing almost nothing to earn its place.
Not because it’s ugly. Not because it’s in the wrong colour. But because it’s saying the same thing to every single person who lands on your page, regardless of who they are or where they are in their buying journey.
A first-time visitor who’s never heard of you. A returning shopper who’s looked at the same product four times this week. Someone is comparing options and drowning in choices. Your CTA greets all three with identical copy and expects identical results.
That’s not optimisation. That’s guesswork dressed up in a button.
What this article covers
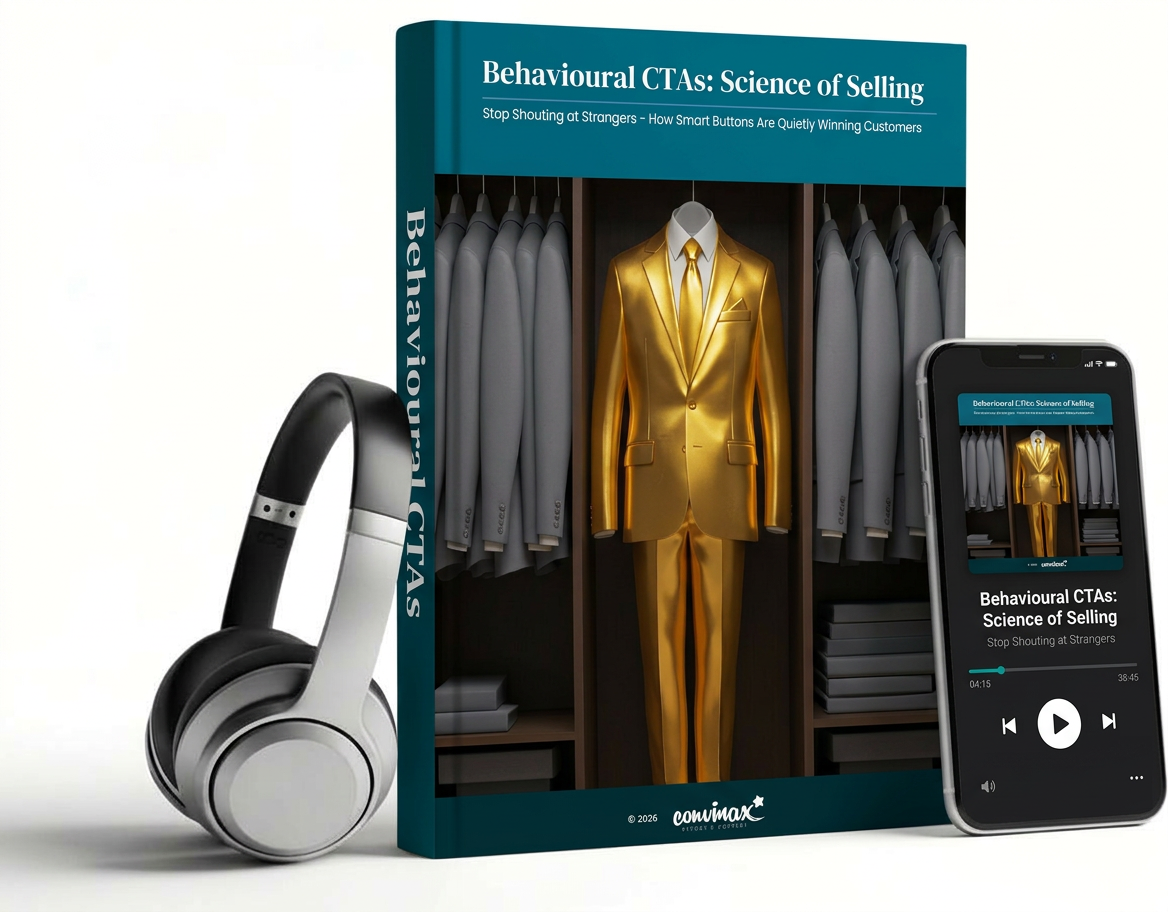
This is a research-backed deep dive into behavioural CTAs – the technique of changing your call-to-action copy based on how a visitor is actually behaving on your site. It’s grounded in cognitive load theory, attention economics, and a substantial body of conversion data.
It covers why the approach works, which visitor types respond to which triggers, how to implement it without a developer or enterprise-level tooling, and how to test it properly so your results actually mean something.
The article is paired with a full audio overview, so you can listen through once, then return to the written version when you’re ready to act.
What the research reveals.
The findings from this article may change how you think about conversion optimisation entirely. Here are just a few of the questions the research answers:
- How much better a personalised CTA performs compared to a generic one – and the number is large enough that most people assume it’s a typo when they first see it.
- The exact point in a browsing session when a visitor’s ability to make a good decision starts to deteriorate – and why your CTA needs to respond to that moment, not ignore it.
- Which CTA colour consistently outperforms the alternative in most tested contexts, and by roughly how much – it’s not the one most designers default to.
- The specific number of product options after which shoppers begin abandoning carts at a measurably higher rate – and what a well-timed CTA can do to interrupt that pattern.
- How much of your traffic is leaving without purchasing, even if your conversion rate sits above the industry average – the real figure is uncomfortable reading.
- How urgency-based CTA copy performs in controlled A/B tests compared to a standard “Add to Bag” – and why most implementations get it wrong by being dishonest about scarcity.
- How little technical resource is actually required to start implementing behavioural CTAs – and which simple segmentation triggers deliver the fastest return.
- How many seconds a visitor takes to complete their visual analysis of your page, and what that means for where and when your CTA needs to land.
An in-depth look into:
- The “7-9 Option” Danger Zone
- The Psychological Power of “My” vs. “Your”
- The Great Colour Debate: Why a Specific Colour Wins
- Counter-Intuitive Placement: The Bottom of the Page
- The 1.4-Second Window
- The “Single CTA” Rule for Emails
- Urgency: Manipulation or Information?
This booklet synthesises findings from:
Academic & Peer-Reviewed Journals
- Boik, A. et al. (2016). The Empirical Economics of Online Attention. National Bureau of Economic Research (NBER) Working Paper. (Foundational research on attention as a scarce resource in digital commerce).
- Ervasti, M. et al. (2023). “Cognitive load during planned and unplanned virtual shopping.” International Journal of Information Management. (Neurophysiological study using EEG to measure mental effort during shopping).
- Gierl, H., & Huettl, V. (2010). “Are scarce products always more attractive?” International Journal of Research in Marketing. (Analysis of scarcity signals and consumer desire).
- Guo et al. (2024). “Can Social Technologies Drive Purchases in E-Commerce Live Streaming?” Journal of Marketing. (Study on the impact of affective vs. cognitive CTAs in live environments).
- Kumar, V., et al. (2019). “The Personalisation-Privacy Paradox: Implications for the Digital Marketplace.” Journal of Interactive Marketing. (Meta-analysis on the financial performance of personalised messaging).
- Lee (2022). “Exploring the personalisation-intrusiveness-intention.” ScienceDirect. (Research on the trade-off between relevance and perceived intrusion).
- Levav, J., et al. (2010). “Order in Product Customisation Decisions: Evidence from Field Experiments.” Journal of Political Economy. (Behavioural economics research on decision fatigue and choice architecture).
- Otterbring (2024). “Utilising eye-tracking data in retailing field research.” Journal of Retailing and Consumer Services. (Practical guide to attention patterns and visual hierarchy).
- Sweller, J. (2011). “Cognitive Load Theory.” Psychology of Learning and Motivation. (Foundational theory on how information presentation affects mental processing).
- Van Diepen et al. (2019). “Calling Customers to Take Action: The Impact of Incentive and Customer Characteristics on Direct Mailing Effectiveness.” Journal of Interactive Marketing. (Analysis of CTA effectiveness across a sample of 179,525 customers).
- Wedel & Pieters. “Eye Tracking for Visual Marketing.” nowpublishers.com. (Core theory and metrics for visual attention).
- Xu et al. (2015). “Not easy to ‘like’: How does cognitive load influence user engagement?” Decision Support Systems. (Experimental research on extraneous vs. germane cognitive load).
Industry Benchmarks & UX Research Authorities
- Baymard Institute (2022–2025). Mobile E-Commerce UX and Product Page Usability Reports. (Large-scale usability audits based on over 150,000 hours of testing).
- Google/Ipsos (2015–2023). “U.S. Micro-Moments Research.” (Insights into mobile-first intent and on-the-spot decision making).
- HubSpot (2021–2023). Personalised CTA Study (Analysis of 330,000+ CTAs over six months) and Case Study Collections. (Statistical evidence that personalised CTAs perform 202% better than generic ones).
- Nielsen Norman Group (2006–2017). “F-Shaped Pattern for Reading Web Content” and “Get Started Stops Users.” (Standard-setting usability research on scanning patterns and descriptive CTA copy).
- Omnisend (2024). BFCM Email Analysis. (Large-scale study of 229 million emails regarding CTA quantity and sales performance).
- Profitero (2024). “The 2024 eCommerce Organisational Benchmark Study.” (Global survey of executives on optimisation KPIs).
- Smart Insights (2025). “E-commerce conversion rate benchmarks – 2025 update.” (Data from 200 million users comparing mobile vs. desktop conversion).
- WordStream. Digital Marketing Statistics. (Benchmarks for website conversion rates and CTA impact).
Brand Case Studies & Professional Implementation Reports
- Amazon Advertising (2025). “Dynamic Creative Optimisation (DCO).” (Technical documentation on real-time personalisation and A+ content improvements).
- Booking.com. Behavioural Strategy Analysis. (Documentation of integrated scarcity, social proof, and urgency triggers).
- Mastercard / Dynamic Yield. “Real-time messaging case study.” (Operational signals on stock urgency and personalised recommendations).
- Sephora (2025). AI Sales and Customer Satisfaction Report. (Case study on 15% conversion lift via AI-driven personalisation and Virtual Artist technology).
- Shogun (2025). “The Ultimate A/B Testing Guide for E-commerce.” (Analysis of conversational popups and timer-based CTAs).
- Storyly (2025). “Sephora boosts conversions and engagement with Storyly.” (Data on interactive content influence on retail orders).
Every claim is cited. Every statistic is sourced. Every recommendation is testable.